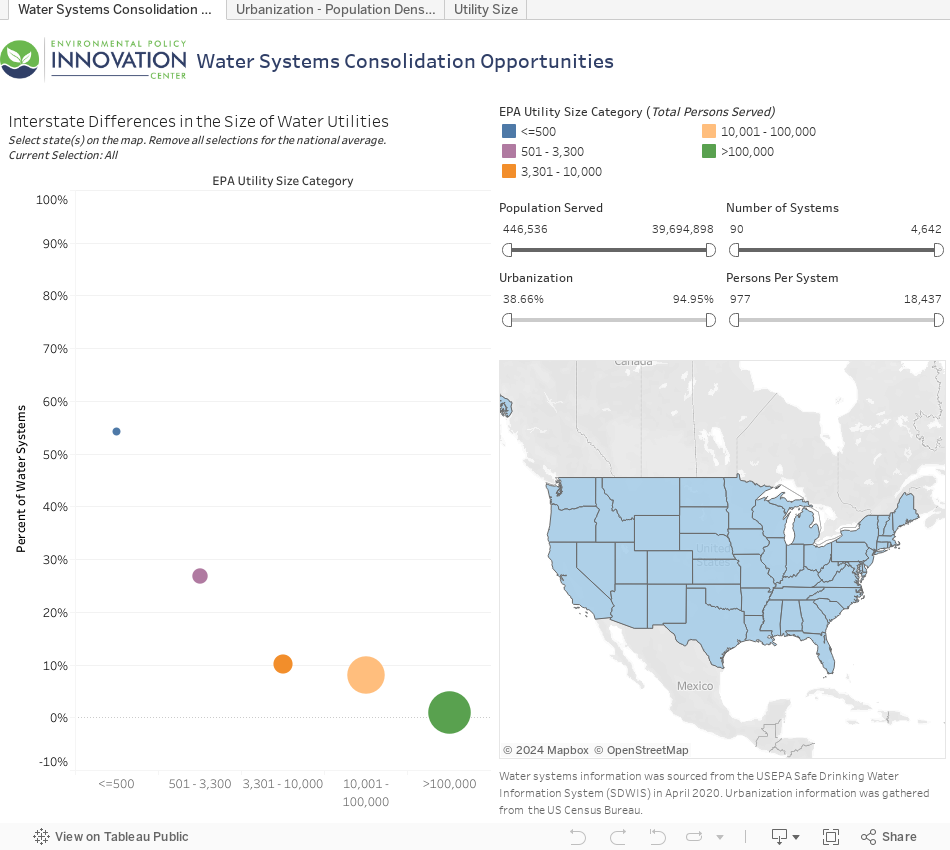
Water Systems Consolidation Opportunities - Visualization Tool
Consolidation policies, including prioritization of State Revolving Fund monies, vary among states, as do urbanization levels which generally correlate with more consolidated utility arrangements. To compare and identify states with potentially promising policies, we developed a Community Water System Consolidation Analysis tool for public use. This tool is comprised of a series of Tableau dashboards, utilizing charts, maps, and filters to enable the identification of states that differ from national and regional trends based on data from EPA’s Safe Drinking Water Information System (SDWIS), supplemented by urbanization data from the U.S. Census Bureau. Data from SDWIS and Census Bureau were collected in April 2020. If the dashboard does not load or respond properly, click here to view it on Tableau directly; an alternate version can be seen here.
Key Insights
What this data shows is that most states - with the exception of a few such as Colorado and Hawaii - have a shrinking number of systems and that new utilities are being created all the time in nearly every state. Based on the historical rate of consolidation, the total number of systems would still be roughly 43,000 in twenty years, while reaching the goal of 75% reduction to 12,500 systems would only occur in the 2130s. It is clear that policy changes must be made in order to facilitate the volume of consolidation necessary to result in meaningful health outcomes.


Examples of state effectiveness in achieving consolidated utilities can most easily be identified in the South. Kentucky, Alabama, and Tennessee all stand out as states with an average of more than 10,000 persons per system despite fairly low rates of urbanization. Kentucky is known for pursuing aggressive consolidation by reorganizing its institutional structure, but neighboring Tennessee and Alabama have a similar composition of utilities. Highly urbanized New England is served primarily by systems with 10,000-100,000 persons. The West follows a similar trend for urbanization and persons per system as the Northeast. In the West and out of all the states, Nevada has the highest percent of population served by 100,000+ person utilities, whereas Wyoming contains no very large utilities. Finally, in the Midwest, there is a wide degree of variation in system density in each state.
Pennsylvania and Ohio are politically and demographically similar states, while Pennsylvania and Georgia would initially appear to have less in common. Our tool, however, shows similar rates of urbanization across all three states (~75%), and a measurably-reduced spread of systems across size categories in Ohio as compared to Pennsylvania and Georgia. Both Pennsylvania and Georgia are far more comparable in terms of utility size distributions, presenting Ohio as a case for further study to policymakers in both states. Nebraska and Nevada are among the 10 least-densely populated states in the country, at approximately 25 persons per sq mi. However, Nevada’s population distribution around Las Vegas has allowed 85% of the state’s population to be served by large systems.
We encourage policymakers and practitioners to use this tool to further understand state-level differences and inform planning efforts. We also encourage other researchers to develop similar, user-friendly tools to further democratize publicly-available, but often hard to access data on drinking water systems.