Mapping out IIJA’s Lead Service Line Replacement allotment process: From assessing infrastructure needs to funding
In 2021, Congress made a historic investment to replace the nation’s 9.2 million estimated lead service lines (LSLs) by appropriating $15 billion through the Infrastructure Investment and Jobs Act (IIJA), also known as the Bipartisan Infrastructure Law (BIL). Since 2023, the U.S. Environmental Protection Agency (EPA) has linked IIJA lead service line replacement (LSLR) funding to service line material data[1] collected from a sample of water systems per state as part of the 7th Drinking Water Infrastructure Needs Survey and Assessment (7th DWINSA) to decide how to allocate IIJA LSLR funds in accordance with state needs. The Safe Drinking Water Act requires EPA to undertake this survey every four years to allocate Drinking Water State Revolving Funds (DWSRF), which includes IIJA funding.
EPA initiated a one-time update to survey responses in late 2023 to better align funding with states’ lead burden (as measured by number of LSLs), since a growing number of water systems are identifying LSLs. In a previous analysis, EPIC found that despite this update, LSL-specific allotments are misaligned with state needs.
These survey responses are critical to determine how much states will receive for LSLR since funds are allocated based on states’ estimated LSLs. Though EPA’s 7th Report to Congress[2] details how DWINSA survey responses have been used to inform how much IIJA LSLR funding each state receives, connecting the dots may not be straightforward to those who are not steeped in DWSRF funding.
EPIC aims to demystify IIJA LSLR allotments here by providing a step-by-step breakdown of EPA’s process to allocate IIJA LSLR funding, from collecting DWINSA survey responses to distributing state funding.
Roadmap
The process by which EPA utilizes DWINSA response data to determine state IIJA LSLR allotment amounts is described in detail in its 7th Report to Congress[3] and can be broken down into three major stages:
Data collection & categorization: DWINSA survey responses are collected from a representative sample of water systems across the country. These are then initially categorized in accordance with reported service line materials.
LSL estimate calculations: Numbers of total LSLs are estimated for each state based on data collected through the DWINSA survey.
Distribution of IIJA LSLR allotments: The proportion of estimated state LSLs relative to the estimated national LSLs is then used to determine the amount of IIJA LSLR funding states receive.
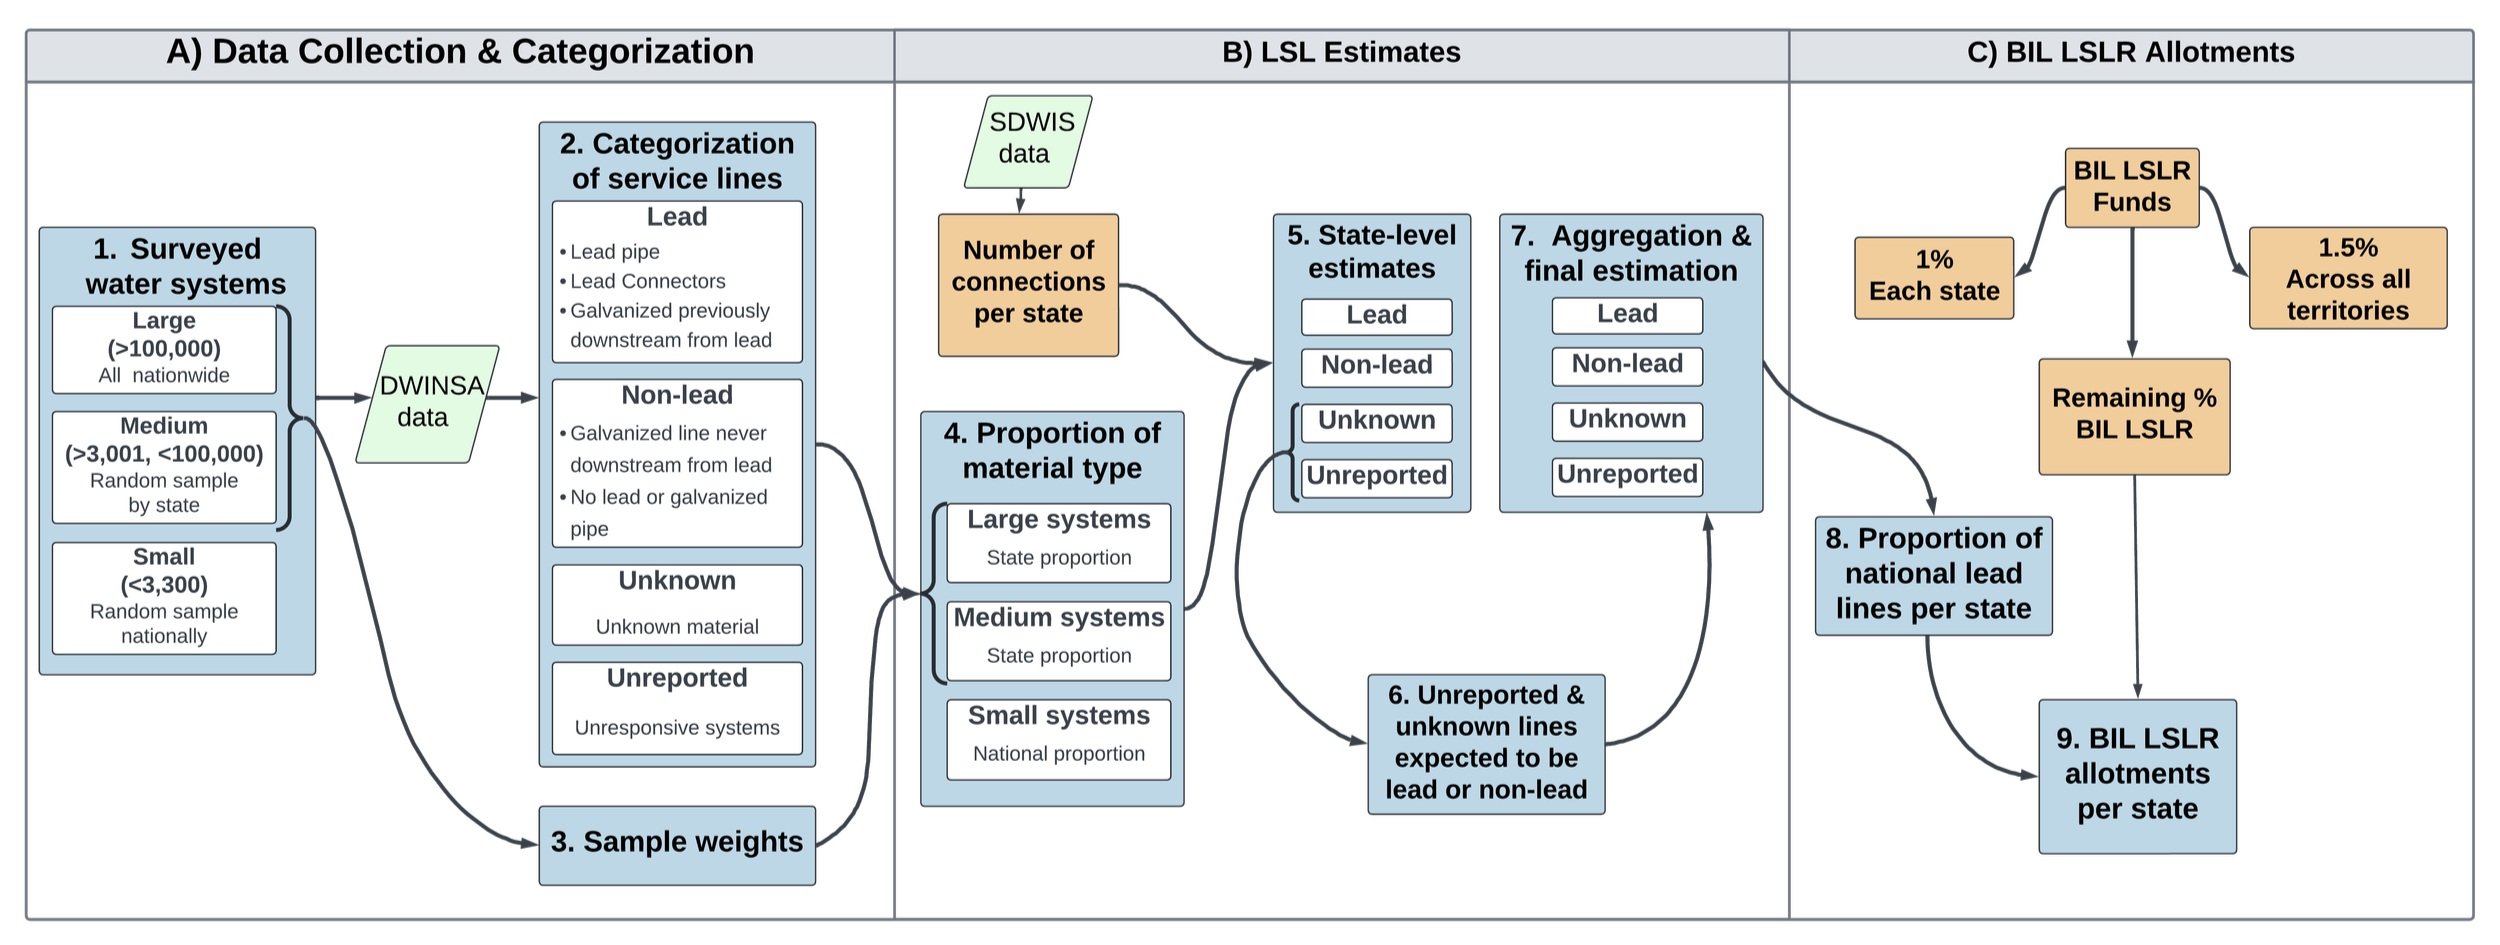
Figure 1. Diagram showing the steps involved in EPA’s process to distribute state IIJA LSLR allotments based on DWINSA Survey Responses. Blue boxes represent each of the steps involved in the allotment process, green polygons represent data sources, and orange boxes represent external data or processes.
A step-by-step breakdown
Now that we have a roadmap of how EPA determines IIJA LSLR allotments based on DWINSA responses, we’ll take a closer look at each of these steps involved throughout the process.
DATA COLLECTION & CATEGORIZATION
To determine states’ water infrastructure needs, EPA collects and categorizes self-reported data from a sample of all water systems across the country via the DWINSA survey.
Step 1: Send out the survey to water systems across the country
EPA sends out the DWINSA survey to a sample of water systems of varying sizes across the country. Through this survey, EPA gathers system-level information on service line materials.
| System Size (Population Served) | Sampling Description |
|---|---|
| Large (serving over 100,000) | Surveys are sent out to all large systems in the country. |
| Medium (serving 3,001 - 100,000) | Surveys are sent out to a random sample drawn from each state. |
| Small (serving 3,000 or under) | Surveys are sent out to a random sample drawn nationally. |
Table 1. Description of EPA’s sampling scheme to distribute DWINSA surveys to a representative sample of water systems across the country.
Step 2: Collect system-level survey responses & assign to material categories
EPA then takes collected survey responses and categorizes service line materials as follows[4]:
| EPA Category | Reported Material |
|---|---|
| Lead | Lead pipes |
| Lead | Lead connectors |
| Lead | Galvanized lines previously downstream from lead or unknown lead source |
| Standalone galvanized | Galvanized never downstream from lead |
| No lead or galvanized material | Lines that do not lead or galvanized pipe |
| Unknown | Material makeup of the service line and/or connector is not known |
| Unreported | Service line belonging to systems that did not submit survey responses |
Table 2. Description of EPA’s service line material categorization based on water system survey responses as implemented for distribution of IIJA LSLR funding. Note that this table reflects EPA’s simplified categorization as per the 7th DWINSA update.[5]
Step 3: Determine sample weights
EPA determines a sample weight for each large and medium sized system, including those that did not reply to the survey. These weights are used to ensure that proportions of service line material calculations are representative of the different system sizes.[6]
EPA provides a brief description[7] of how sample weights are calculated for each system based on categorizations defined by the water system’s source and population size served. However, due to lack of clarity on how these system categories are defined, and no available data on the resulting sample weights, this step of the process remains a black box, thus impairing reproducibility of state-level LSL estimates.
LEAD SERVICE LINE ESTIMATES
EPA then uses the data collected from the sample of surveyed water systems to estimate the total number of LSLs within each state as well as nationally.
Step 4: Calculate proportions of service line materials
EPA calculates the proportion of reported service line materials based on system-level DWINSA responses. However, because medium and large systems are sampled differently than small systems, these proportions are calculated differently depending on system size.
Medium & large systems
For medium and large sized systems, EPA calculates the proportion of service line materials by state.
Small systems
For small systems, EPA estimates the national proportion of service line materials belonging to each of the reported material categories.[8]
Step 5: Estimate the number of each service line material by state
To generate state-level estimates for each service line material, EPA multiplies the proportions calculated in Step 4 by the total number of connections belonging to small, medium, and large systems in each state obtained from the 2019 Safe Drinking Water Information System (SDWIS Fed) data.[9]
Step 6: Estimate the number of unknown or unreported lines projected to be lead (or non-lead)
Service lines of unknown materials as well as unreported lines must inevitably belong to a material category (e.g., lead, non-lead). One way to think about it is that we lack information about the compositional material of these lines.
To overcome this lack of information, EPA assumes that the proportion of unknown and unreported service lines that are in fact lead is the same as the proportion of known lead service lines (see Step 4).
To calculate the number of unknown or unreported lines that are expected to be lead (or another material), EPA multiplies the estimated number of unknown/unreported lines calculated in Step 5 by the proportions of each of the other “known” material categories (e.g., lead, galvanized, etc.) determined in Step 4.[10]
Step 7: Final projected estimates of lead service lines
Final state-level projections of LSLs are then calculated by adding the initial estimated number of LSLs (Step 5) and the number of unknown and unreported lines expected to be lead (Step 6).[11]
DISTRIBUTION OF OF IIJA LSLR ALLOTMENTS
Finally, EPA allocates IIJA LSLR funding to states based on their proportional share of national estimated LSLs.
Step 8: Calculate national proportion of LSLs per state
EPA calculates the national total LSL number by tallying all estimated LSLs across all states and U.S. territories. EPA then calculates the proportional share of each state’s estimated LSLs relative to the national total.[12]
Step 9: Determine LSLR allotment amounts
EPA determines the amount of funding each state receives, after Congress appropriates IIJA LSLR funding and deducts earmarks. The Safe Drinking Water Act (SDWA) requires the EPA to first ensure that each state receives a minimum allotment of 1% and 1.5% be distributed across all U.S. territories.[13]
The remaining IIJA LSLR funds are then distributed to states based on the percentage of national LSLs they have based on DWINSA results in order to align funding with lead burdens.
Conclusions
Hopefully, you now have a better understanding of how EPA determines state IIJA LSLR allotments through the Drinking Water State Revolving Fund. You can learn more about how State Revolving Funds flow by reading our explainer and explore how far the IIJA LSLR funds can go in replacing the nation’s LSLs by checking out our blog and interactive map.
1 US EPA, Office of Water. 2023. Drinking Water Infrastructure Needs Survey and Assessment: 7th Report to Congress p. 23. https://www.epa.gov/system/files/documents/2023-09/Seventh%20DWINSA_September2023_Final.pdf
2 Ibid p. 23 and p. 42
3 Ibid p. 42
4 Ibid
5 US EPA. One-time Update to the 7th DWINSA Lead Service Line Questionnaire: Factsheet. September 2023. https://www.epa.gov/system/files/documents/2023-09/One%20Time%20LSL%20update%20DWINSA_FACTSHEET_Final.pdf
6 Ibid p. 43
7 Ibid
8 Ibid pp. 44
9 Ibid
10 Ibid p. 45
11 Ibid
12 Ibid p. 23
13 40 CFR § 35.3515 as revised August 7, 2000. https://www.ecfr.gov/current/title-40/chapter-I/subchapter-B/part-35/subpart-L