In collaboration with SimpleLab, the Internet of Water Coalition, and through dialogue with over 120 academic, nonprofit, for-profit, and government partners, we created the first comprehensive national dataset of drinking water service area boundaries.
From Justice40 tracking and drought planning to answering the question of, “is my water safe to drink?” - this data can help to improve the design and implementation of water and climate programs at the federal, state, and community level.
We shouldn’t have to wonder “Who is responsible for my water?” We should know.
We invite you to use this map and search for the communities that matter to you. Federal, state, and local partners all have a part to play, and we invite you to explore your role in improving and leveraging this data.
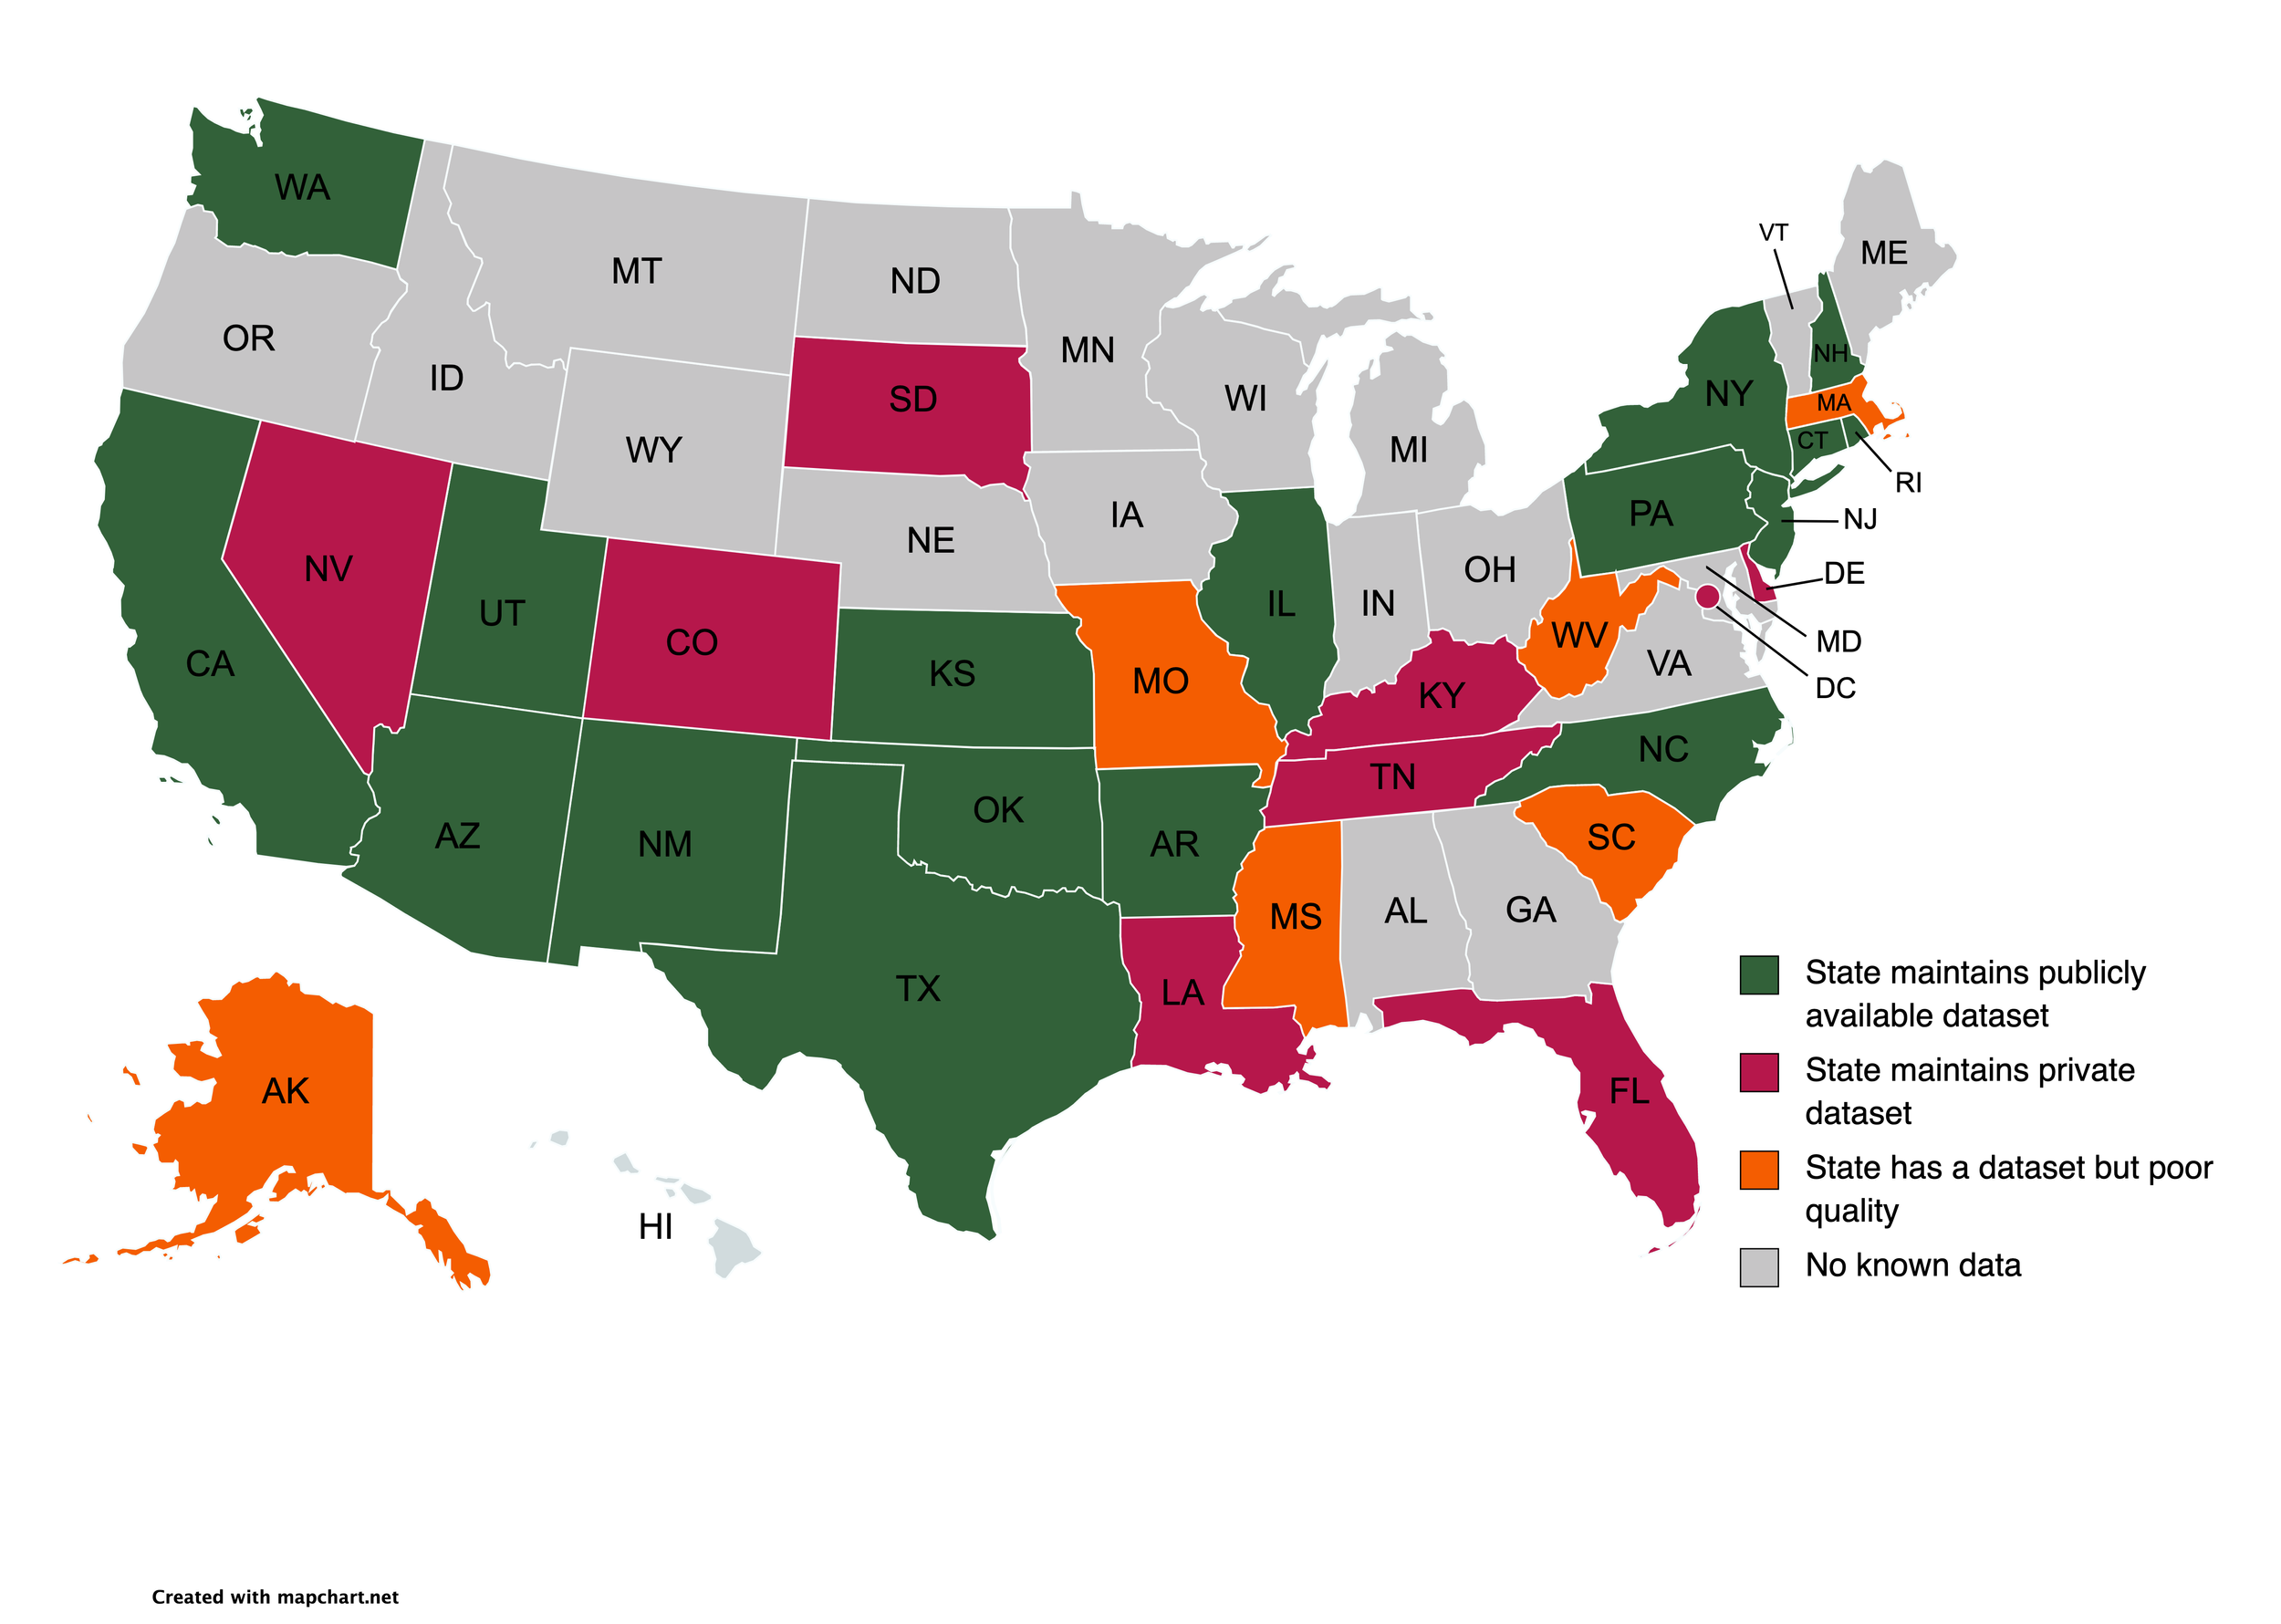
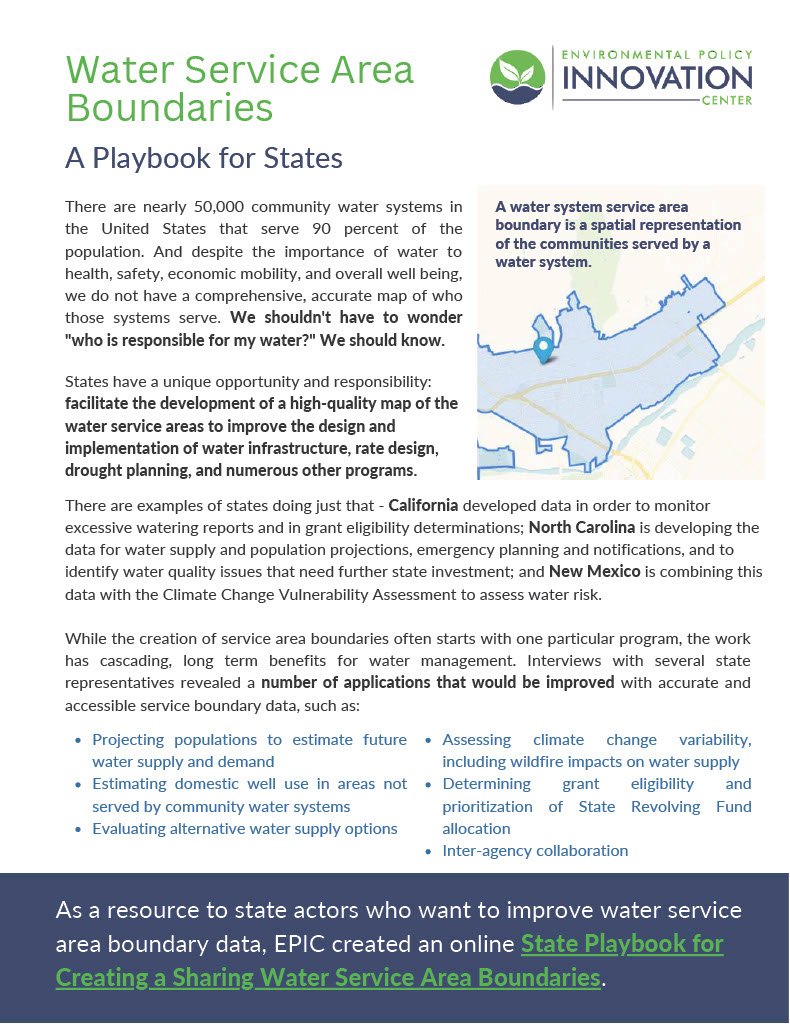
There are nearly 50,000 community water systems in the United States that serve 90 percent of the population. Despite the importance of water to health, safety, economic mobility, and overall well being, we do not have a comprehensive, accurate map of who those systems serve. In a March blog post on service area boundaries, we discussed the patchwork availability of service area boundary data and that most water systems lack accessible boundary data entirely.
Get Involved.
There are several ways to improve data quality and utility of these data - we are keen to work with partners to make it happen.

State Playbook for creating the data
States have a unique opportunity: help develop a high-quality map of the water service areas in your state to improve the design and implementation of water infrastructure, rate design, drought planning, and numerous other programs.
Improve the Data.
35 states do not have data, or did not make their service area boundaries publicly available. Whether you are a public or private utility, state regulator or community advocate, there is a role for you to increase data coverage and quality.

Make Technical Contributions.
Our partners at SimpleLab wrote up a detailed explanation of the project and developed an open-source repository for technical partners to review our methodology and contribute to data creation and refinement.

Develop policy solutions.
We are working with state and federal agencies to provide funding and develop policy solutions for long-term data maintenance and upkeep. Have ideas or made progress in other states? We’d love to collaborate with you.
Publications


Case Studies


Progress to date
In eight months, we built a high quality understanding of where 157 million people – i.e. more than half of the US population – gets their water from. In the first two months of the project, we built the first unified national approximation of this data. Following the initial release, we added four additional states data (Arkansas, Rhode Island, Utah and Illinois), and we then continued to improve through targeted outreach to water systems that served over 100,000 people and were not in states that maintained service area boundaries. Within three months of outreach following our initial data publication, we have now added boundaries for 50 large water systems which results in a more precise understanding of water service for ~17 million people!

Curious to dig into the weeds? Read more about the details of data and improvements below.
-
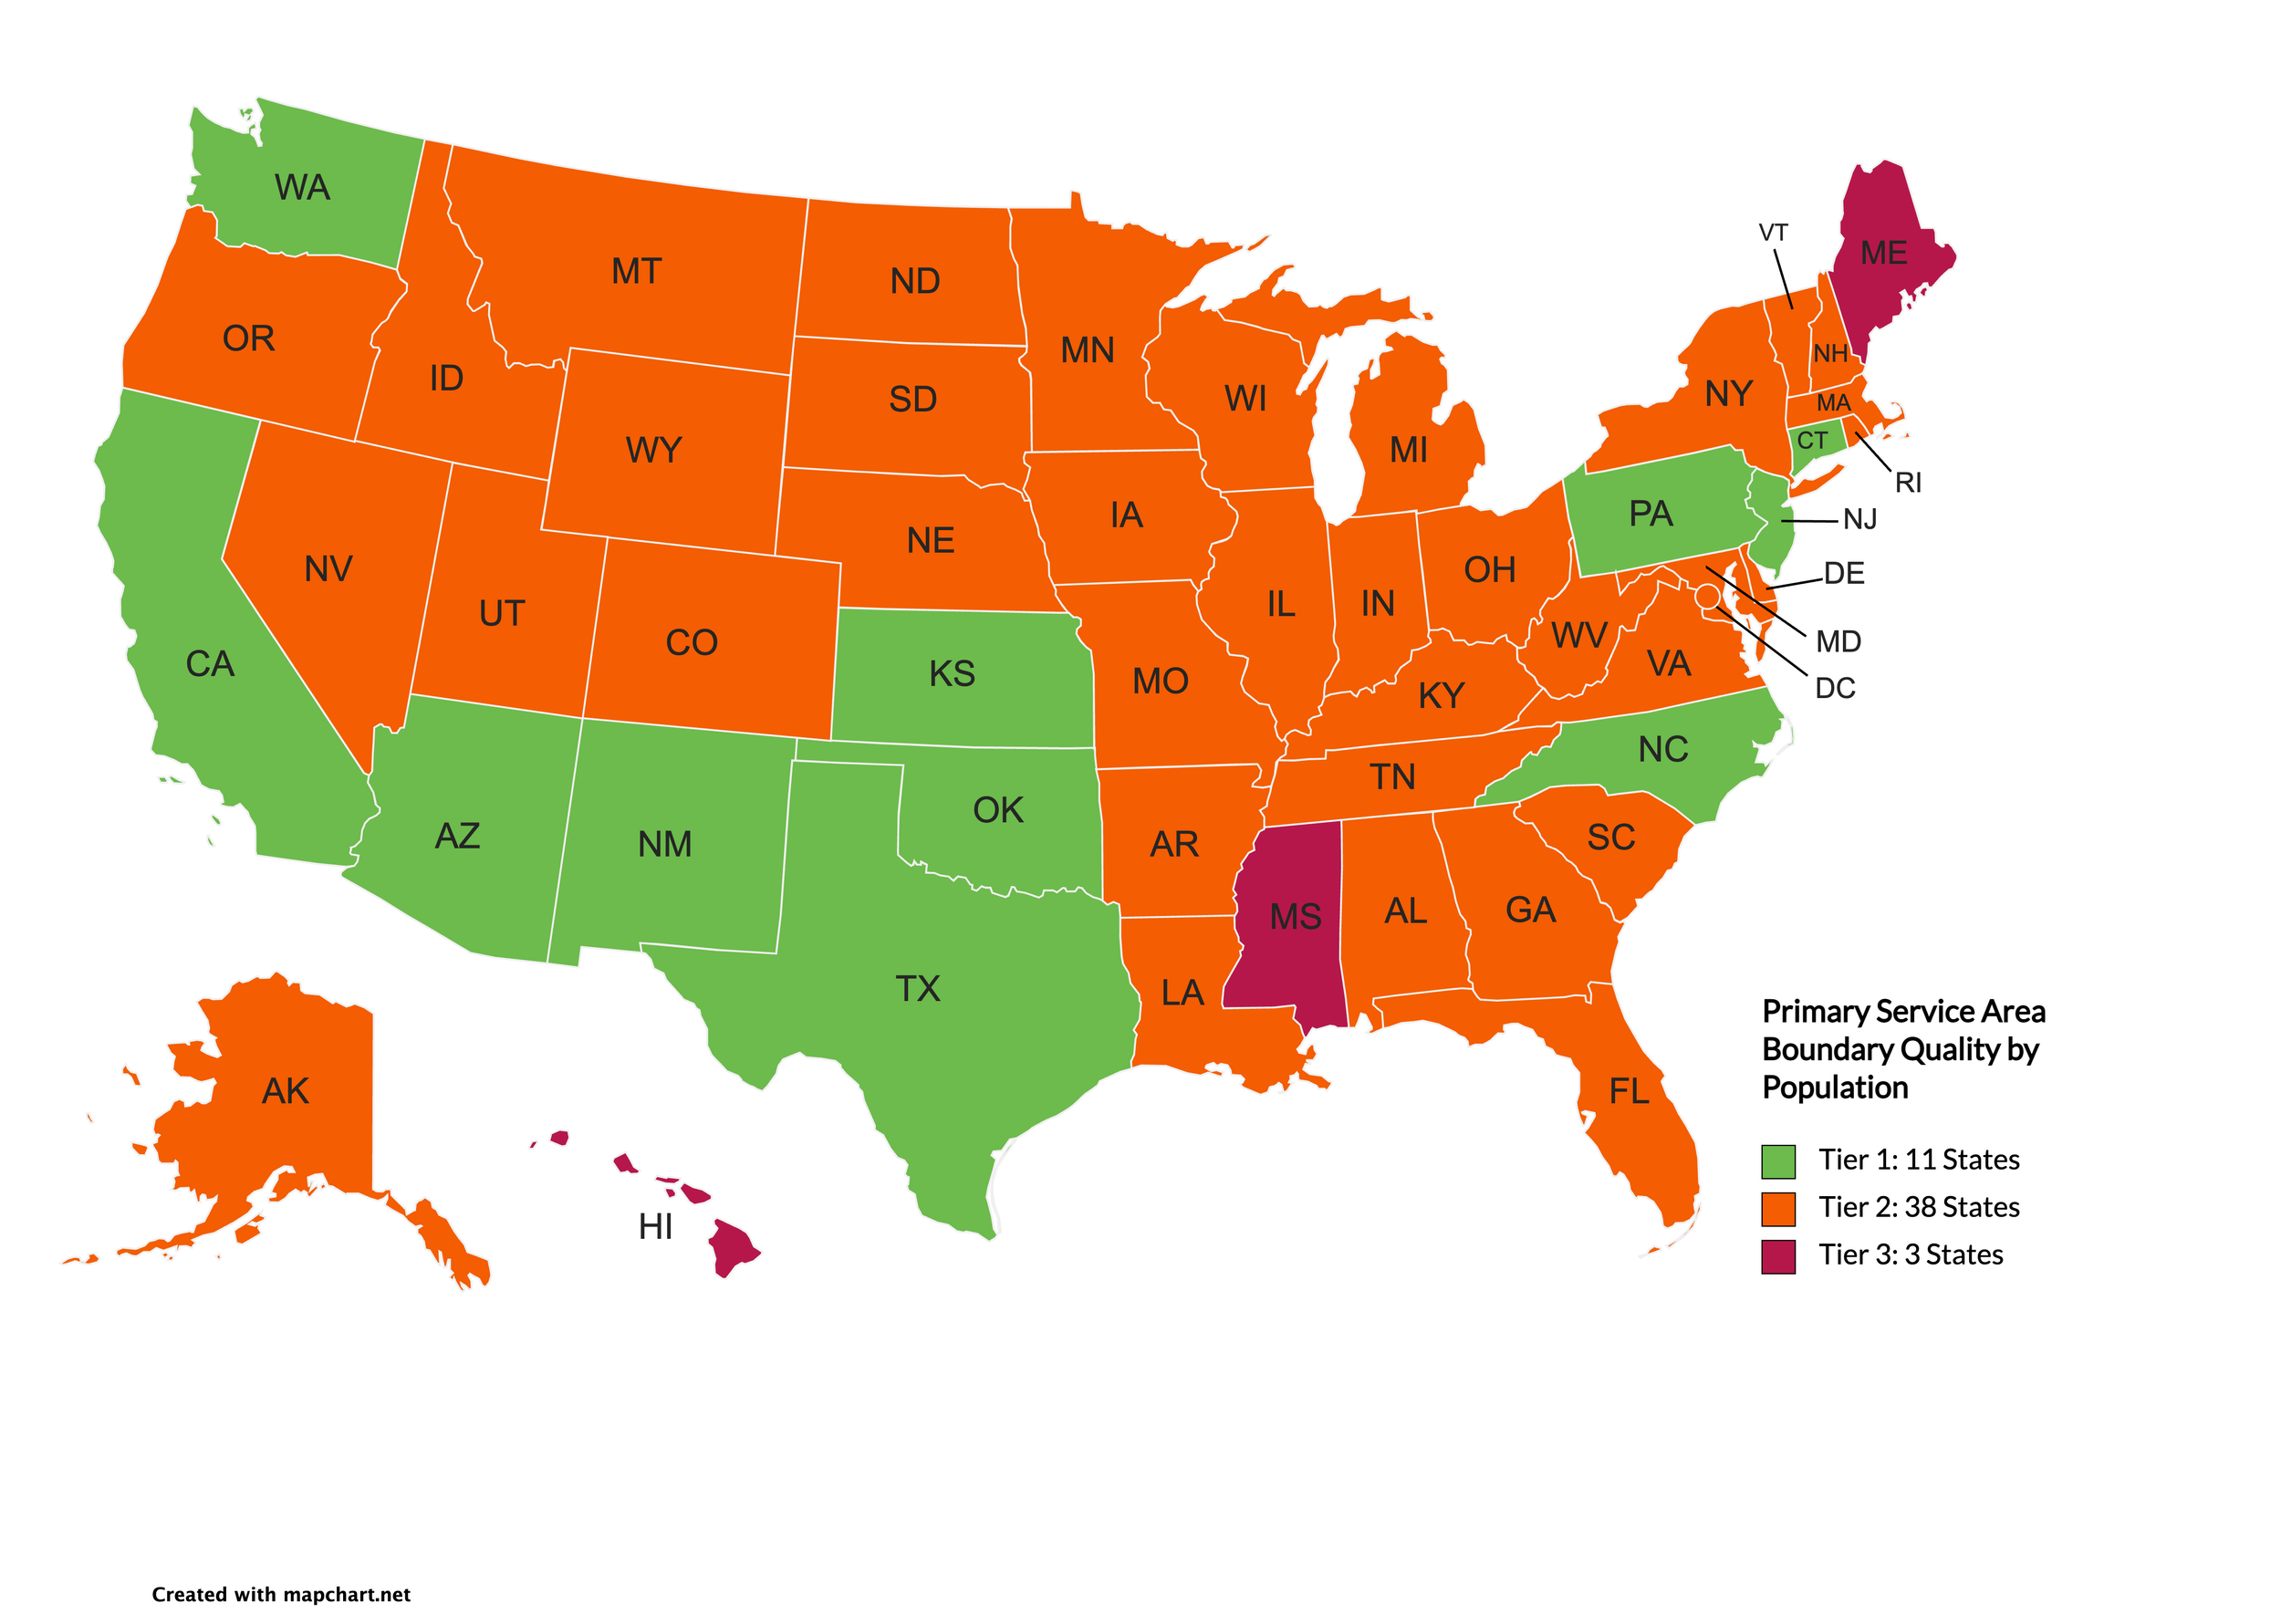
As of November 2022, there are 17, 645 water systems that provide service to 155,869,771 people covered by Tier 1 systems.
This represents the following states: AZ, CA, CT, KS, NC, NJ, NM, OK, PA, TX, WA, IL, UT, AR, and RI.
We also reached out and collated data from 50 of the largest water systems that were in states that did not maintain a centralized service area boundary dataset to incorporate their data as well.
-
As of November 2022, there are 11,079 water systems that provide service to 111,074,087 people in Tier 2 data category. This data is approximated from where the water system name matches the census place boundary.
Since the release in April, we removed multiple water systems assigned to the same census place boundary by improving our matching method to reassign Tier 2b systems into either Tier 2a or Tier 3.
-
As of November 2022, there are 17,249 water systems that serve 40,771,645 people in the Tier 3 data category.
-
There are 3, 451 water systems (~7%) that do not have any boundary data.
Support for this work was received from the Bezos Earth Fund.