
We’re Falling Short On Measuring Environmental Justice Efforts—Better Tools Can Help.
Written by Christopher Putney and Gabriel Watson | Graphics by EmmaLi Tsai
Delivering on Environmental Justice (EJ) for historically underserved and pollution-burdened communities requires all hands—and data—on deck. That means leveraging data to measure complex burdens cumulatively, representing lived experiences, and weighing impacts and benefits to inform equitable investments across communities.
From academic institutions to federal agencies, a variety of criteria, data, maps, and tools have been developed to address these multidimensional factors of EJ. Colloquially known as “EJ Tools,” many of these assets use similar and overlapping data (e.g., income, demographics, environmental burdens, etc). And although each tool is useful for its specific purpose, the broader ecosystem of EJ tools (and associated guidelines) often leaves users of all sorts—advocates, state program administrators, federal funding applicants—unsure of what EJ tools are out there and which ones they should use. We often hear questions like: What EJ tool is best suited for my work? and, Why should I choose one tool over another? Stakeholders also tend to express uncertainty or skepticism that a particular tool actually reflects local conditions or their experience.
That’s why EPIC built an EJ Tool Inventory: to help funding applicants, advocates, policy makers, and developers alike navigate—and we hope, collaborate across—these tools. Now, more than ever, EJ Tools need a culture of collaboration and connection around them to thrive. Development efforts kept in isolation from each other—and from the people these tools are designed to empower—will hamper innovation across this ecosystem, and in the end, limit our ability to reach the communities most in need.
Another gap we see is getting actionable feedback on EJ tools and criteria from users. In other words, once a tool is launched, how do we understand how users and decision-makers actually utilize them in the course of their work? To that end, we want to hear from you! Please take a moment to tell us how EJ tools fit into your work (or work you hope to do); even if you have limited experience using them. Responses are anonymous.

EPIC’s EJ Tool Inventory uses data originally compiled by Urban Institute to map tools operating at federal, state, and local levels. You can access the Tool Inventory here.
Why An EJ Tool Inventory, Why Now?
The 2022 launch of the White House’s Climate and Economic Justice Screening Tool (CEJST)—a tool built by the Council on Environmental Quality (CEQ) and the US Digital Service (USDS)—brought EJ tools into the public spotlight as many users questioned how this differed from the well-known EPA EJScreen. At the time, we called CEJST a “simple map with big implications,” given its potential to drive Justice40 efforts to deliver “40 percent of the overall benefits of certain Federal investments” to communities long burdened by pollution and marginalization.
More than a year later, we see a dizzying array of Disadvantaged Community (DAC) and EJ definitions, and a host of maps and tools that federal and state agencies use for permitting, funding prioritization, and benefits tracking (among numerous other uses). Some of these tools are simple, while others are complex and feature-rich (e.g., EPA’s EJScreen).
Enter our overarching goal for this EJ Tool Inventory: to make it easier for applicants, advocates, policy makers, and engaged stakeholders to navigate this ecosystem of criteria and maps.

EPIC’s EJ Tool Inventory allows users to cross-reference overlapping themes linked to data sources (i.e., across EJ Tools).
EPIC’s role as a listener, convener, and contributor in the EJ tool space has informed the need we see for this Tool Inventory—and we hope it empowers users to do essentially two things: (1) find and view EJ tools alongside each other for reference and comparison purposes, and (2) encourage meaningful connections and collaboration between EJ tool owners and users.* In other words, we hope this inventory will help build a community of practice and give potential users a growing menu of assets at their disposal. To be sure, considering the scope and complexity of the EJ-related challenges we face, we don’t think a single, comprehensive EJ tool is realistic or even desirable—numerous initiatives, communities, and agencies all have particular needs and thus require specific tools. But in order for communities in need to actually get access to resources, users across the EJ landscape must be able to find and leverage the tool best suited for their purpose.
**Note: As of October 2023, our EJ Tool Inventory is up-to-date for federal EJ tools. While there are some state and local tools, we expect to do a more comprehensive update of state/local tools by the end of 2023.
We hope that state or federal program administrators, policy makers, developers, and advocates alike will engage with the problems we’ve sketched with EJ Tools; even if that merely prompts new conversations.
EPIC’s Tool Inventory helps users navigate EJ tools based on the nuances and data layers (e.g., race) relevant to their work.
EJ Tool Development: The Process Matters!
In late 2022, alongside dozens of other policy organizations, advocates, and technologists working on EJ issues, EPIC’s Technology Team delivered detailed feedback to CEQ on an early iteration of CEJST. Like many organizations working in the EJ space, we saw CEJST’s potential role in helping realize the promise of Justice40 across communities—as well as a broader set of federal EJ commitments made in recent Executive Orders and historic climate-related legislation.
In CEST, communities are identified through “disadvantaged” census tracts that cover all 50 states, the District of Columbia, and US territories—and are considered disadvantaged if they meet criteria for at least one of the tool’s categories of burden. After several rounds of open source feedback from EPIC and other voices, CEQ incorporated improvements from the Beta version to CEJST 1.0—focusing on a better methodology and user interface (UI) for defining, analyzing, and engaging communities in need. For instance, CEJST moved to new datasets (like Tribal areas), added climate data layers (like flood and wildfire risk), as well as historically redlined urban areas. Some layers, like historical redlining data, only added a handful of tracts to the tool—yet these suggestions, and the space provided to offer them, were anything but semantic. Without user feedback, the tool would have continued to obscure racial and income inequalities, overlook historical nuances, and ultimately hamper funding for the communities most in need.
CEQ took a page from the tech industry playbook throughout that process—leveraging a “Release, Revise, Repeat” approach to tool development—and it’s for that reason that CEJST marked a dramatic, welcome shift in executive branch efforts around EJ goals. And while (as of this writing) not all of these changes have been implemented—accounting for the impact of cumulative burdens, for example—we are optimistic that most, if not all, will be incorporated soon.
Still, it’s not our aim to convince anyone that they should adopt EPIC’s (or anyone else’s) preferred EJ tools—or that advocates should only focus efforts on high profile tools like CEJST. The CEJST experience simply demonstrates, we think, that users and developers can move rapidly on better data and user experience (UX) with a deliberate, open source effort. Beyond—but connected—to that approach, we think the next chapter in our collective efforts to deliver data-driven EJ outcomes requires things like robust cross-agency coordination, goal alignment, and wrap-around guidance for all users; and that technologists and advocates alike will be hamstrung if we don’t nurture collaboration, agree on standard features, and data/UX best practices across the tools we use.
Navigating the EJ Tools Ecosystem
Of course, CEJST wasn’t the first tool of its kind—and it certainly benefited from earlier models of innovation. Take California’s CalEnviroScreen, a decade old state effort to identify communities “disproportionately burdened by multiple sources of pollution.” Like many of the EJ tools that have proliferated in recent years, CalEnviroScreen was the product of specific—but often vague—policy decisions made much further upstream; in this case, the state’s 2012 “Cap and Trade” program where a portion of targeted revenue is redistributed to the most impacted communities (defined by CalEnviroScreen’s criteria).

Today, CalEnviroScreen is the backbone of California Climate Investments, which has achieved 50% of benefits to Priority Populations, and it guides climate and energy policy and programs across other agencies and utilities.
Similar to CEJST, CalEnviroScreen’s early role was using data to illuminate disadvantaged communities—those threatened by pollution hazards and social vulnerabilities—so they might be better connected with public resources. In CEJST’s case, this meant using federal census tracts and other criteria to guide delivery of federal funding at the unprecedented scale of the Justice40 initiative—which remains the overarching set of goals tied to that funding. But both CEJST and CalEnviroScreen were effective attempts to make EJ goals real because they helped render marginalized communities more visible.
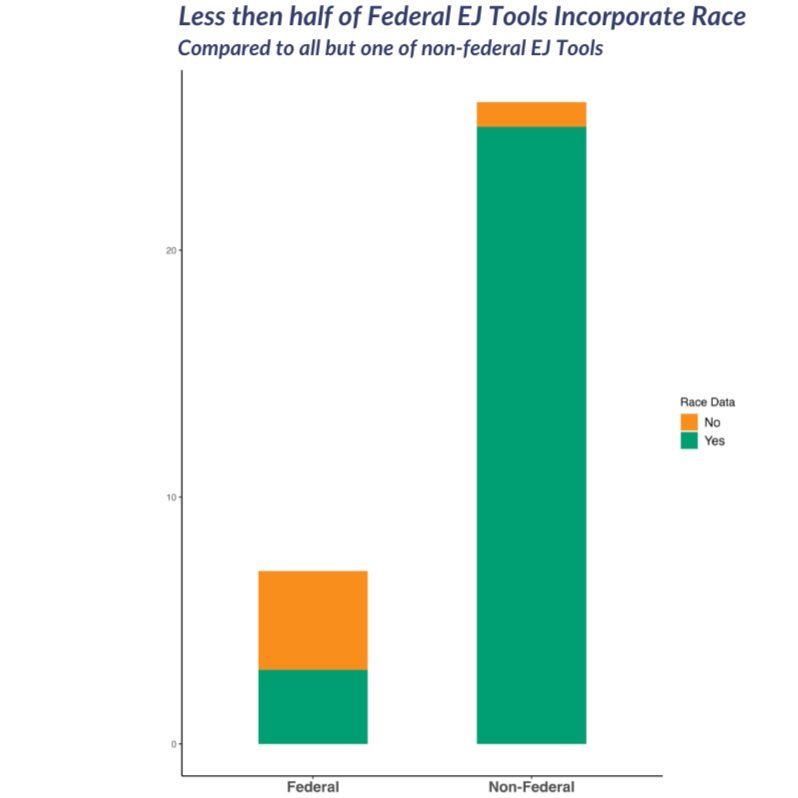
Still, the issue—one we hope our Tool Inventory will highlight—is that as numerous as they've become, not all EJ tools are interchangeable or complimentary. Some tools, for example, include local and state data sources while others exclusively use federal data. Some use disaggregated race (or other demographic) data and incorporate community input—while still others lack any local knowledge or regional data layers, and include virtually no community input from those they intend to serve. One reason for this status quo has become resoundingly clear to us: EJ tools and their methodologies are often written into policies—which advocates and government users historically scrutinize—yet they rarely scrutinize the tools themselves.
“State staff feel that their agencies are using federal and state EJ screening tools as required, primarily to prioritize or determine funding among applicants. However, few are using maps or tools proactively, e.g., to prioritize outreach or direct technical assistance. Some...feel that existing screening tools fail to identify communities they know to be underserved, and are unsure about which tools and criteria to use and when...”
In fairness, equitable, data-driven decision making supported by EJ tools isn’t easy in any scenario—and no one expects technologists or users, at any level, to deliver perfect tools out of the gate. Yet when it comes to the policies that mandate such efforts, policy makers often fail to specify standards, key terms (e.g., “disadvantaged,” “burdened”), or iterative development guidelines—and those oversights generate absurdly complex downstream effects on tool development. For instance, although many EJ tools were initially designed for explicit, targeted measurement use cases linked to specific programs, others were more open-ended—even intended by lawmakers for informational or planning purposes only, or built mostly with non-governmental advocates in mind. Many of these intended (and potential) uses are not communicated clearly, leaving permitting and funding applicants and advocates uncertain about what tool to use and when.
The effect of this scenario has been a veritable cottage industry of EJ Tools: a proliferation in recent years of fragmented, siloed development efforts across state and federal organizations and NGOs—and one that often yields serious confusion for would be users, communities in need, as well as government, given its hodgepodge of non-standard methods, metrics, and benefit delivery approaches. And while we do think diverse approaches to tool development are generally good for innovation in data-centric settings, the increase in EJ tools—without a community of practice built around common standards, user guidance, and methodologies—ultimately hinders our collective ability to get benefits to communities who need them.
We think small changes can have an outsized impact in terms of addressing some of these upstream factors—and that’s exactly what we’re focused on with this new Tool Inventory. For instance, if a dedicated working group (or other collaboration mechanism) were established for the EJ space, tool developers and users of all kinds could build a community of practice to meet their needs, design helpful guidance and standards, and create the EJ Tools equivalent of something like NOAA’s Climate.gov—an excellent demonstration of how data-driven tools and tailored resources can be built around best practices and robust user needs.
Putting Best Practices Into Action
So where does that leave us today? In developing this inventory, EPIC’s Technology Team leveraged some of the best practices we hope EJ tool users and developers will continue to utilize and refine. In our view, they include the following:
Ask for user input early and often—especially from communities who stand to benefit. The promise of these tools can only be realized if users trust and use them. Start with experiences in communities and find data that reflect that experience. Get feedback wherever you can!
Learn who's already working on your problem before your start. (Begin by poking around our Inventory!). In order to thrive, grow, and serve big-picture EJ needs, owners and users of tools need to build a community of practice with collaboration and integration at its center.
Release, Revise, Repeat! Build EJ tools with diverse users in mind—and make features lightweight and easy to update. It’s ok if early tool iterations are meant to be conversation starters with key stakeholders, advocates, or potential partners; but the more user guidance and simplicity a tool has, the better outcomes will be.
Build on quality, pre-existing work from partners operating in the EJ space. There’s no need to invest tons of resources in duplicative efforts (for instance: we developed and modified Urban Institute’s excellent research on screening tools to build this Tool Inventory).
Looking ahead, we think it’s worth reiterating: if EJ tool users and development efforts remain fragmented and siloed, innovation will be limited across this ecosystem—and, in the end, so will our ability to reach communities most in need. That’s why we hope this Tool Inventory will serve as a starting point; not just for discovering EJ tools, but for building a culture of connection and collaboration aligned to shared EJ goals.
Do you work on or with EJ Tools? We want to hear from you! Please tell us about your EJ tool experience via this anonymous survey.
For more information on leading EJ tools, check out these organizations and their efforts across this ecosystem: Urban Institute’s Screening for Environmental Justice Framework; Lawyers for Good Governance’s 50-State Survey of State Policies to Help Ensure Federal Investments Benefit “Disadvantaged Communities”; and Center for Neighborhood Technology (CNT)’s Beta Tool (comparing CEJST and other federal tools).