Bringing Human-Centered Design into Restoration Tracking
This blog was co-written by Jessie Mahr, Director of Technology at EPIC, and Kylon Chiang an independent product designer; it summarizes a collaborative effort between EPIC, the US Digital Service, Sijia Pitts and Kylon Chiang to demonstrate opportunities to use human-centered design to make natural resource agencies more accessible.
Government staff at agencies are often understaffed and lack resources.... It's no wonder that many agency websites aren't as technically sophisticated and well designed as similar tools in the private sector. Still, we rely on information from government websites. As agencies embrace more modern approaches to web-design and tool development the delivery of that service and information are improved. With the expansion of programs like US Digital Corps, 18F, and US Digital Service, many agencies are now better able to access the services and approaches to modernize their services. And there is an opportunity to ensure that this work reaches environmental agencies as we know many programmatic staff that often remain unaware of their services and continue to lag behind technological progress made in other sectors.
Realizing the national visions laid out in administration initiatives on environmental justice, climate change, ecosystem services, and conservation requires a whole-of-government approach to data collection, sharing, and use. We sought out to see where there may be opportunities for better design of web-based tools and data that support the implementation of environmental initiatives.
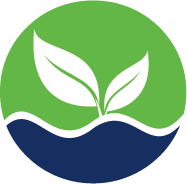
Given the critical importance that wetlands play in mitigating the impacts of climate change, and the need for restoration across the US, we started with the Regulatory In lieu fee and Bank Information Tracking System (RIBITS). RIBITS was developed by the U.S. Army Corps of Engineers to track thousands of wetland and stream restoration projects required under the Clean Water Act. Five more federal agencies have since expanded use of and support for RIBITS, to track voluntary conservation projects on farms, water-quality trading and species banking projects.

RIBITS homepage
There is no doubt, RIBITS is an instrumental website for tracking and managing mitigation projects, but there are several areas that could be strengthened to improve the usability. This made it a great candidate to test out a human-centered design approach to modernize the platform and increase accessibility.
What did we do?
Environmental Policy Innovation Center and the US Digital Service created an interdisciplinary team of designers, programmers and restoration enthusiasts to explore ways to improve the accessibility of RIBITS. Over the last three months, we conducted research, engaged with RIBITS users and ideated on some features that could be improved to better serve the restoration and mitigation community. While we could spend pages nerding out about RIBITS, for this blog we are going to dive into the human-centered design process we used and how it could be a model for future initiatives as there are no shortage of environmental program websites that could benefit from this approach.

The project team presenting to the Army Corps of Engineers about our design process.
Let’s dive in.
We used the Human-Centered Design (HCD) process to create and evaluate a feedback-driven alternative of RIBITS to increase the accessibility and utility for those looking to understand trends of mitigation banking in the US. HCD helps builders remove most of the guesswork from the development process by understanding their target users’ goals and workflows from the start. However, while there are some standard procedures, HCD is by no means a linear process—it may take many twists and turns, and what we describe here is just one example of how the process can look. We encourage you to seek out methods that best help you to empathize with your users, and don’t be afraid to keep it fun and experiment!
Choose an Audience
Generally speaking, HCD projects start out by defining a target audience. They’re the people who put the “human” in “human-centered design,“ and this is done because different groups of people have different needs so we need to consider them separately. Having a target audience also has the added benefit of grounding the team in the needs of a specified user group to keep the project scope in check. A project without a clearly defined audience runs the risk of doing too much without actually addressing the needs of any specific user group, while the opposite may cause the project to not meet the needs of the target audience.
Our project began as an open exploration of common pain points across various user groups within RIBITS. However, given that we were focused on a demonstration project within a short timeline, we chose to narrow our focus to the state agencies and organizations that depend on RIBITS for environmental permitting and evaluating national trends because we felt that they would have a holistic understanding of RIBITS and key areas to prioritize for updates.
Takeaway: Start the project by defining a target audience to help focus the impact of the work. This will ensure that the team is always building for the benefit of this user group.
A user shares his screen and walks us through his process and pain points.
Set the Scene
Once the target audience has been established, it’s time to explore the problem space. The goal at this stage is to learn as much as possible about why users are frustrated. A good way to start is to have conversations with target users who face the problem on a regular basis because they’ll most likely have a lot to say on the matter. Data gathered from these conversations will later guide the brainstorming process, so it’s important to have a(n) interview/conversation guide to keep discussion organized and on topic. This can be done by defining some high-level objectives for the conversation, then adding prompts and questions to obtain information that will meet these objectives.
Our team sought to understand the reason behind why our specified user group used RIBITS and the challenges they faced when using the platform, so the interview guide prompted participants to walk us through their workflow to show us how they use the platform, focusing mainly on the parts where they become stuck. This exercise brought to light very clear examples of how people struggled when they used RIBITS, as well as their work-arounds for these problems. These observations then led to conversation around potential areas of improvements for RIBITS, and the ideas just kept flowing!
Takeaway: Create a(n) conversation/interview guide with the people in the specified user group who have experienced the problem that the team is exploring to gain deeper insight and observe specific examples about the challenge at hand.
Name the Problem
Now comes the time to analyze all the data that the team has gathered, and there are many ways to do this, but the key is to walk away with actionable takeaways. Find the largest common denominator that creates pain points among the users and think about what can be done to improve the experience. This will take time and practice, so don’t feel disheartened by the process. Just remember to leave all assumptions at the door and let the takeaways emerge organically—the kinds of findings that turn up may be surprising. Another tip is to split up the analysis work among team members, then schedule work sessions to review the findings together to make sure everyone is aligned on the results.

A snapshot from our affinity diagram in Miro that clusters ideas/sentiments from RIBITS users by themes.
Our team chose to create an affinity diagram, which required each member to review several interviews and extract key ideas onto virtual sticky notes in Miro. Once every interview had been reviewed, we clustered the sticky notes according to similar ideas/sentiments to form bigger idea groups. These groups were kept to between 4 to 6 sticky notes each, and each group was given a descriptive statement to describe the idea. Then, we proceeded to create superclusters with these groups, and gave each of these superclusters a descriptive title to encompass all the idea groups below it. And the affinity diagram was complete!

A snapshot from the user journey in Excalidraw.
In parallel with our data synthesis, we also built a user journey map in order to lay out the user workflow. This method allowed us to perform a deeper analysis of user interactions within RIBITS and reveal the areas of opportunities for improvement. We also attached user sentiments to each step of the journey to gauge where the greatest amount of frustration was occurring to make sure our solutions target those areas.
Takeaway: There’s no singular/correct method to analyze user data. The important thing is to let the data speak for itself by finding their greatest common denominators and use those ideas to propel the project forward.
Put Pen To Paper
The team has now articulated the problem, so next comes the most exciting part! Grab some paper and pens and get everyone sketching. There are many helpful brainstorming exercises on the web if the team is having trouble getting started, but try to bounce thoughts off of each other and use an additive process to build on each other’s ideas. Have everyone come with several ideas and try not to shoot down any ideas in the early stages. Review all ideas as a team then begin to prioritize ideas based on impact and feasibility.

A sketch of a redesigned home page.
Our team took a similar approach by having all team members sketch out their vision for a new RIBITS. We then shared these ideas back with each and used a sticker voting system to find the “hotspots” within our collective sketches. We used this feedback mechanism to determine the ideas that we would be bringing with us into the next step.
Takeaway: Get everyone on the team involved in the brainstorming process! Sketch and share as many ideas as people have and gradually decide together which ideas will move forward.
Create the Vision
Depending on the team’s timeline and resources, there are also several options for how the team can build the first prototype. Paper prototypes are a low-effort and have a fast turnaround time, but it requires a lot more of people’s imaginations. On the other hand, digital prototypes are higher effort and more time-consuming to build, but they can look closer to the real thing. This also isn’t an either-or option—the team can start with paper prototypes then gradually move to digital as ideas become more concrete.
Our team was asynchronous and remote, so we opted to start with a digital prototype. This also made our ideas easier to share and review. However, we did notice that people were sometimes caught up on the visual aspects of our prototypes, so that’s another drawback of digital prototypes.
Takeaway: Start building the thing! Every medium has its benefits and drawbacks, so choose according to the team’s needs and preferences.
Review and Reorient
To figure out whether or not the team built the right thing, just ask the users! Just like the start of the project, bring the prototype to the target audience and have them try it out. Ask them to use the team’s prototype to do the task that always frustrated them. Observe any kinks they run into and make note of them because the team can use this feedback to make improvements to the prototype or change directions, if necessary. An important reminder here is to refrain from over-explaining because if the user doesn’t get it, then it could indicate that the idea needs some work.
Our team reached back out to the stakeholders we initially interviewed and gathered their feedback on our ideas. These sessions confirmed that we were headed in the right direction and also revealed aspects of RIBITS that we hadn’t considered but could fold into a new iteration of our prototype, or explore as separate concepts in future improvements.
Takeaway: Ask users in the target audience to test the team’s prototype and observe any issues that come up. Use this feedback to make improvements on the prototype.
And that sums up our team’s process! As this post suggests at the beginning and the end, the HCD process is not linear and is driven forward by an iterative loop of testing and prototyping, until the team determines that the design is ready to be built and published.
We hope this has been an instructive read and happy designing!
